Radioactivity Dynamics in River System
(2018)
QAre areas around rivers dangerous? Is river water contaminated with cesium still running?
AThe Ministry of the Environment summarized radioactive contamination data on rivers and lakes in 2015 and estimated exposure doses from water-based recreational activities in such environments.
The results show that the exposure dose from water-based recreational activities is 0.03 mSv at the maximum over a 20-day period even when conservatively estimated. This is well below the threshold for evacuation orders, 20 mSv per year.
Table 1 Estimated exposure doses from water-based recreation (Ministry of the Environment, 2015, partially modified)
| Rivers | Lakes | |||
|---|---|---|---|---|
| Scenario* | Average scenario | Conservative scenario | Average scenario | Conservative scenario |
| Radioactive cesium concentration in bottom material (Bq/kg) | 200 | 2,000 | 500 | 5,000 |
| Air dose rate in surrounding environment(µSv/h) | 0.3 | 0.6 | 0.2 | 0.5 |
| Estimated exposure dose(mSv) | 0.013 | 0.031 | 0.0086 | 0.030 |
* The radioactive cesium concentration in bottom material and the air dose rate in the surrounding environment in the average and conservative scenarios were set based on the median and the 90 percentile of the values obtained in Fukushima Prefecture (except for evacuation-order zones).
Source: The Ministry of the Environment, Material 5 “Estimation of Exposure Doses from Water-Based Recreational Activities (Summary)” in “13th Meeting of the Environmental Remediation Study Group” (January 2015)
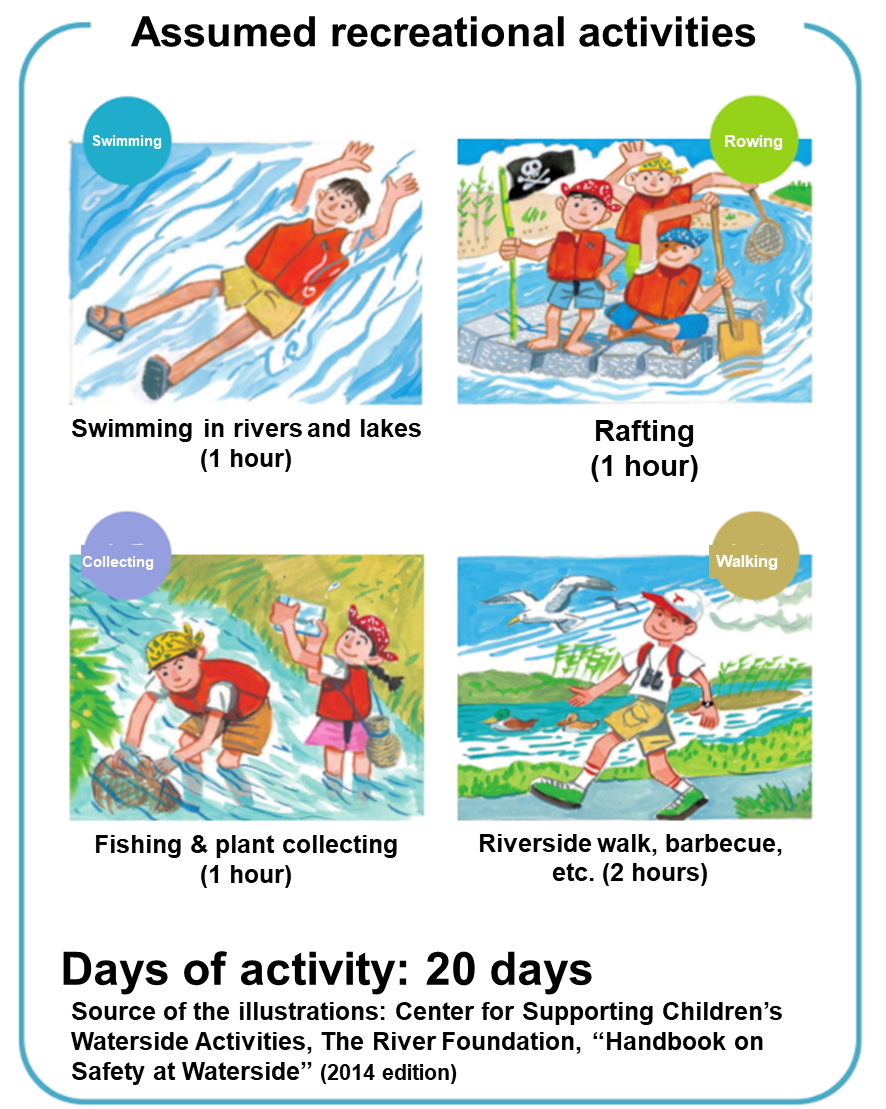
Fig.1 Examples of water-based recreational activities
Cesium tends to accumulate on dry riverbeds where cesium-contaminated soil carried down by rivers is deposited.
We surveyed the depth distribution of cesium concentration in the soil of dry riverbeds over several years.
The results showed that cesium concentrations were lower in soils deposited in shallow parts of the riverbed. This means that cesium concentrations in the soils carried down by rivers are decreasing year after year.
In addition, we have also found that doses reduce as soils with low cesium levels cover older soils, creating a radiation shielding effect.
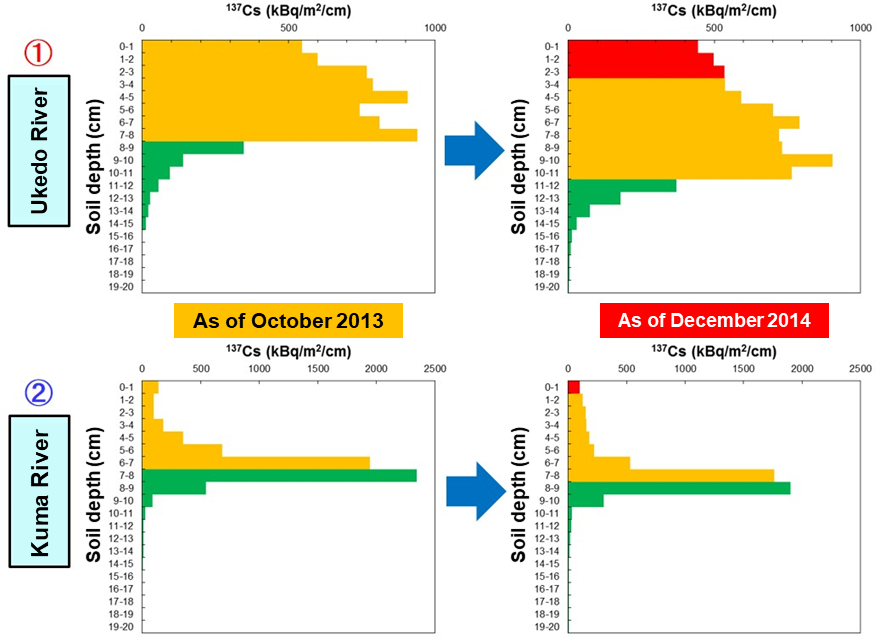
Fig.2 Chronological changes in the depth distribution of radioactive cesium concentration in the flood plains of the Ukedo River (top) and the Kuma River (bottom)
■ : Initial deposition
■ : Sediments through October 2013
■ : Sediments through December 2014
Note: The unit in the above charts represents 137Cs depositions, or the amount of 137Cs present in the unit area (1 m2) within 1 cm thickness.
We have also repeatedly measured the cesium concentration in river water.
In flowing river water, cesium is present in two forms: a suspended state, where cesium adheres to soil and organic matter; and a dissolved state, where cesium is dissolved in water.
Our surveys show that in either state, the cesium concentration is decreasing over time.
We have also found that the time needed for the cesium concentration to reduce to half is shorter than the physical half-life of cesium, which is the time it takes for cesium to reduce to half in amount after radiation emission.
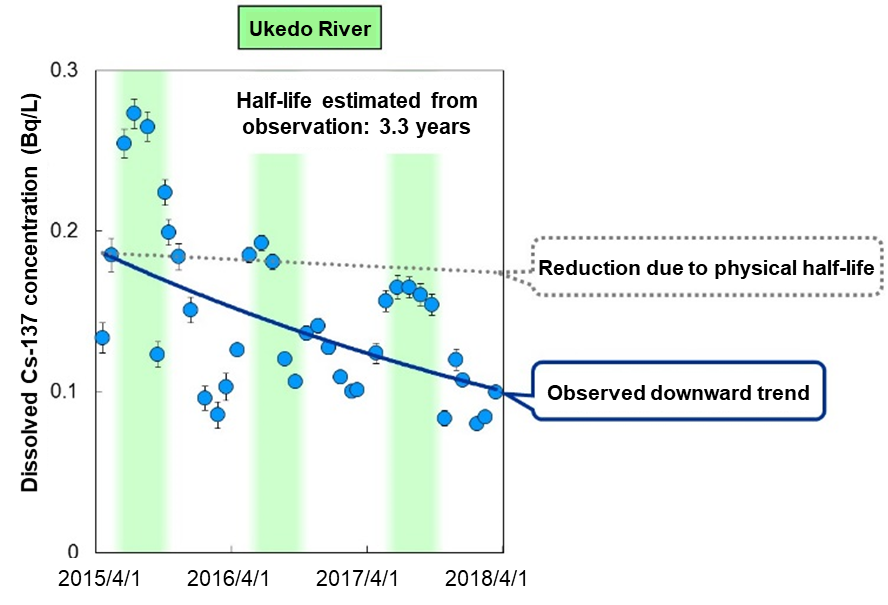
Fig.3 Changes in the concentration of dissolved cesium observed in the Ukedo River
The reduction of cesium deposited on soils over time means the decrease in radiation levels on dry riverbeds.
On the other hand, the reduction of cesium dissolved in water means a reduced impact on the ecosystem, such as freshwater fish.
Our research continues to uncover why the time needed for the cesium concentration to reduce to half is ten times shorter than the physical half-life of cesium, and how this new finding can update our predictions of the environmental impact of cesium, which still remains in some areas.
Related articles
- In what kinds of land use is radioactive cesium deposited? How much is deposited?
- Is it possible to use water from contaminated rivers and reservoirs for irrigation water?
- In what kinds of land use is radioactive cesium deposited? How much is deposited?
- I heard most of the forests would not be decontaminated. Does cesium remain in the forests?
- How much did the amount or the concentration of Cs released to river water by forest fire? How did them change by time?