Effects on Ecosystem
(2021)
QHow have ecosystems changed in evacuation-order zones?
AWe have been monitoring various organisms such as mammals, birds, frogs, and insects since 2014. The data obtained for mammals and birds are publicly available on a website, which is routinely updated.
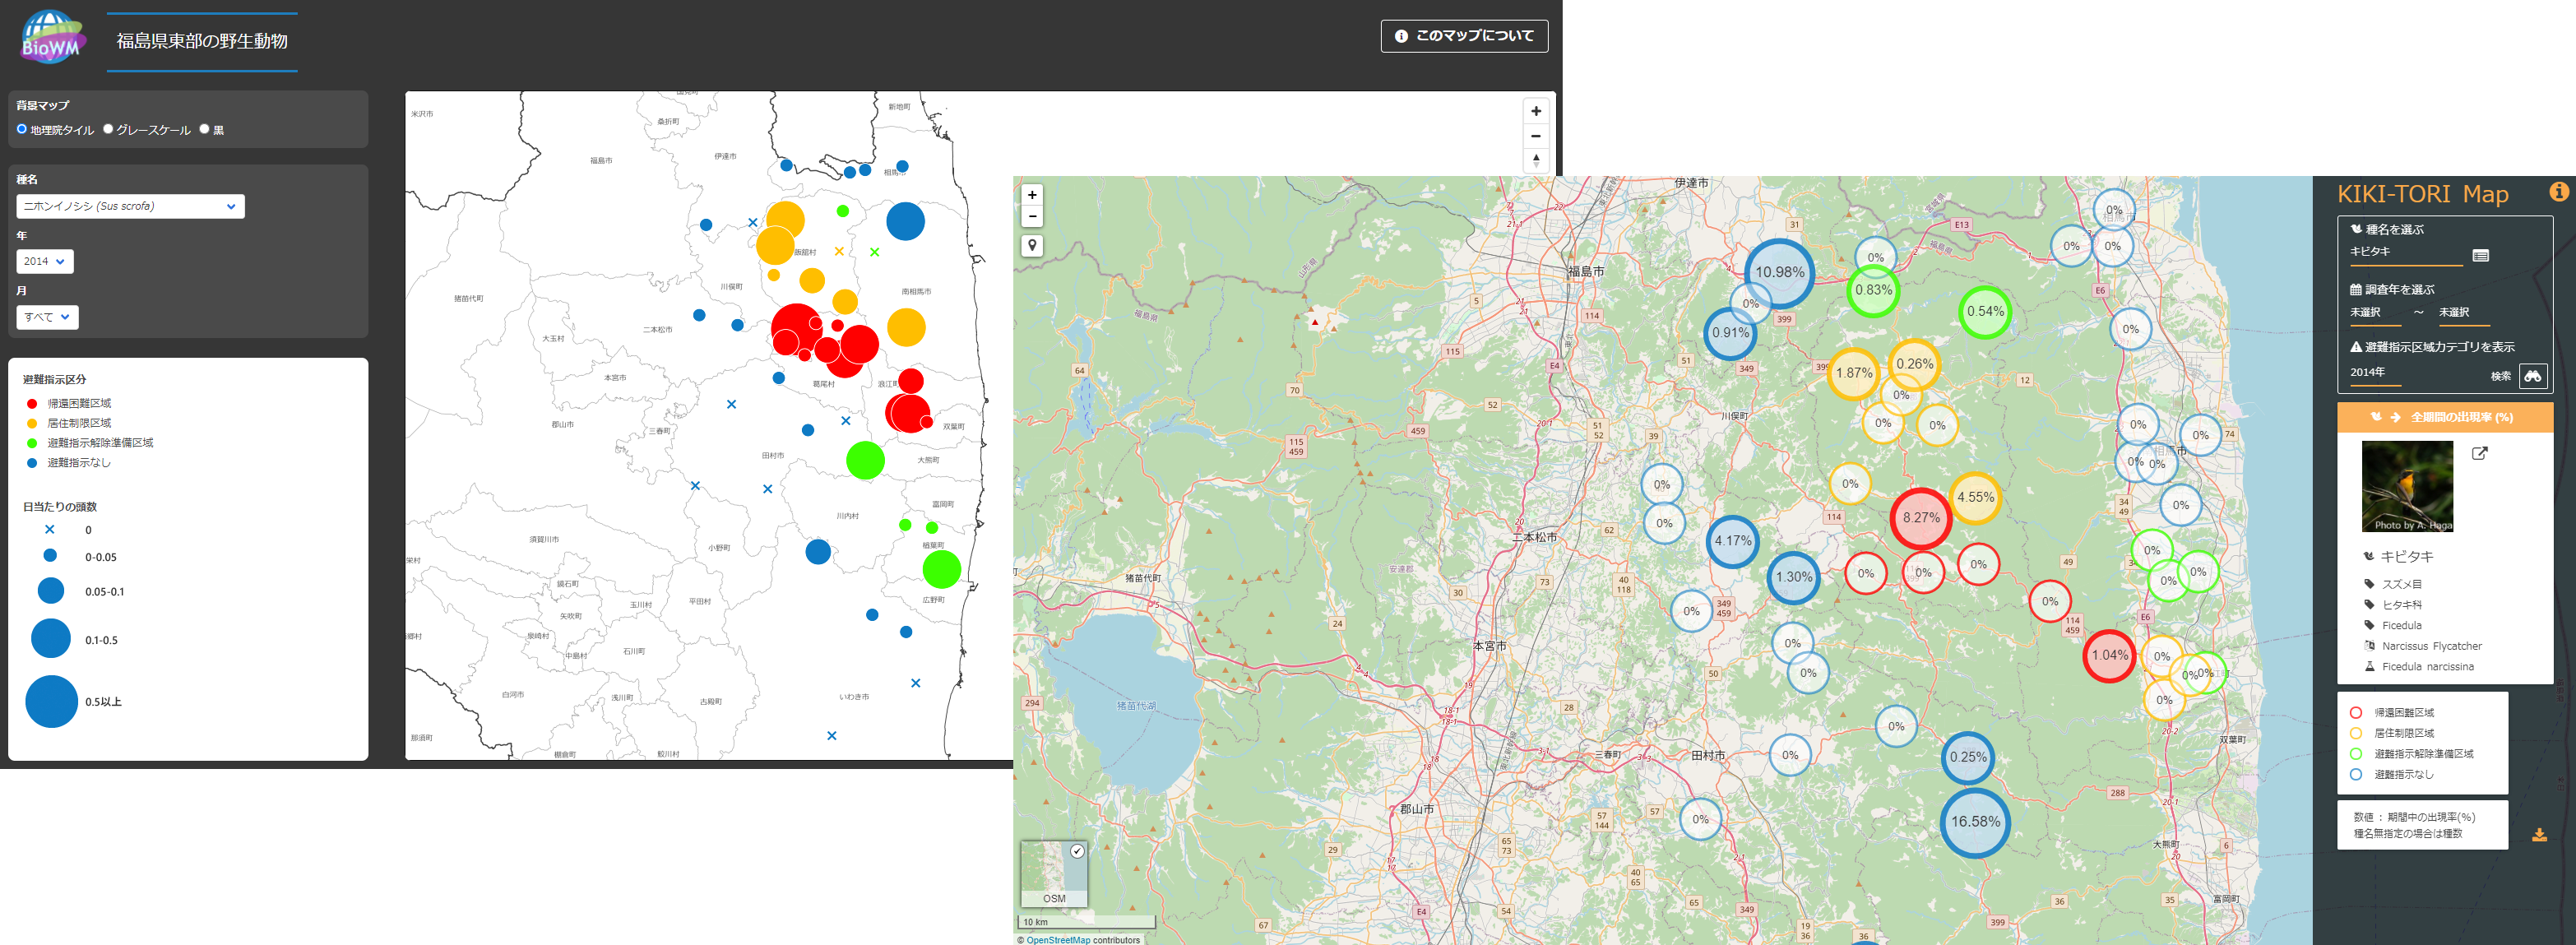
Fig.1 Frequency of appearance of mammals and birds
The monitoring data for mammals and birds are publicly available to researchers in the form of published papers, which is updated from time to time. Distribution maps are also available for easy browsing at the National Institute for Environmental Studies (NIES) websites: BioWM and KIKI-TORI Map.
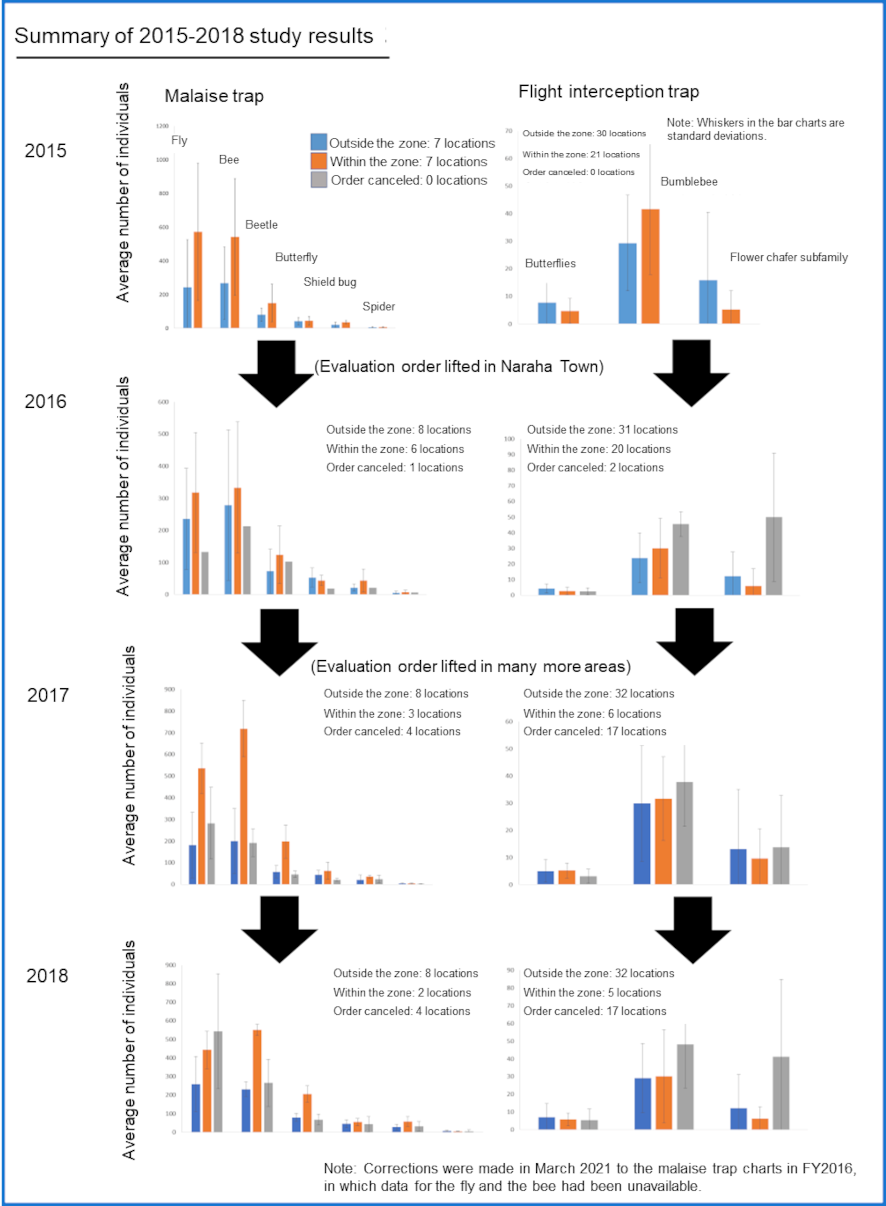
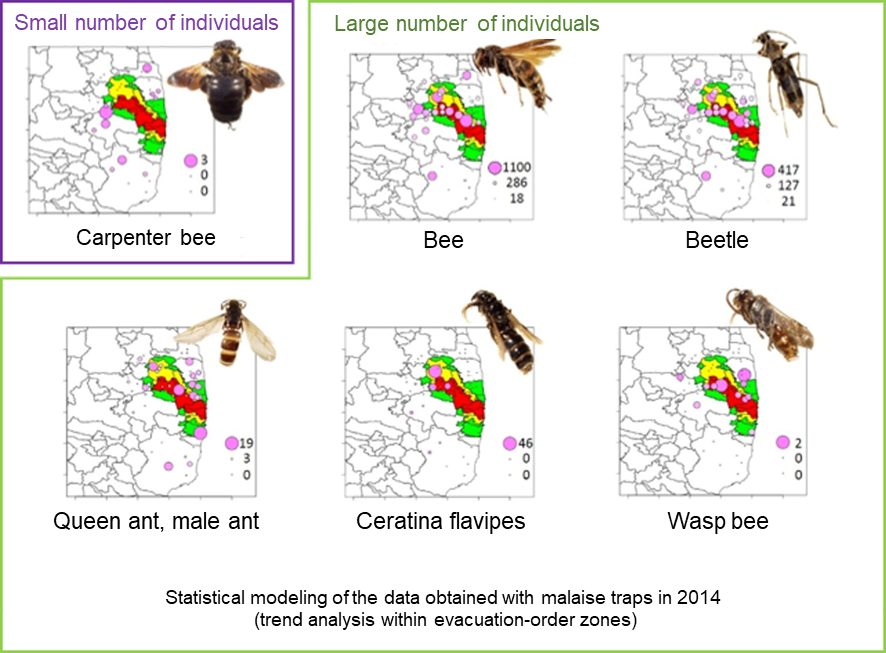
Fig.2 Number of insects caught by traps
This study is conducted by trapping insects within and outside the evacuation-order zones (also in zones where the evacuation order has been canceled).
We have been using statistical modeling to determine whether the data obtained for this study reflects the influence of the evacuation order or is simply coincidental.
The number of individuals of almost all species of polliniferous insects collected in 2014, with the exception of the carpenter bee, was not significantly small in the evacuation-order zones.
Following mammals and birds, data for frogs was released in 2020 in data paper format.
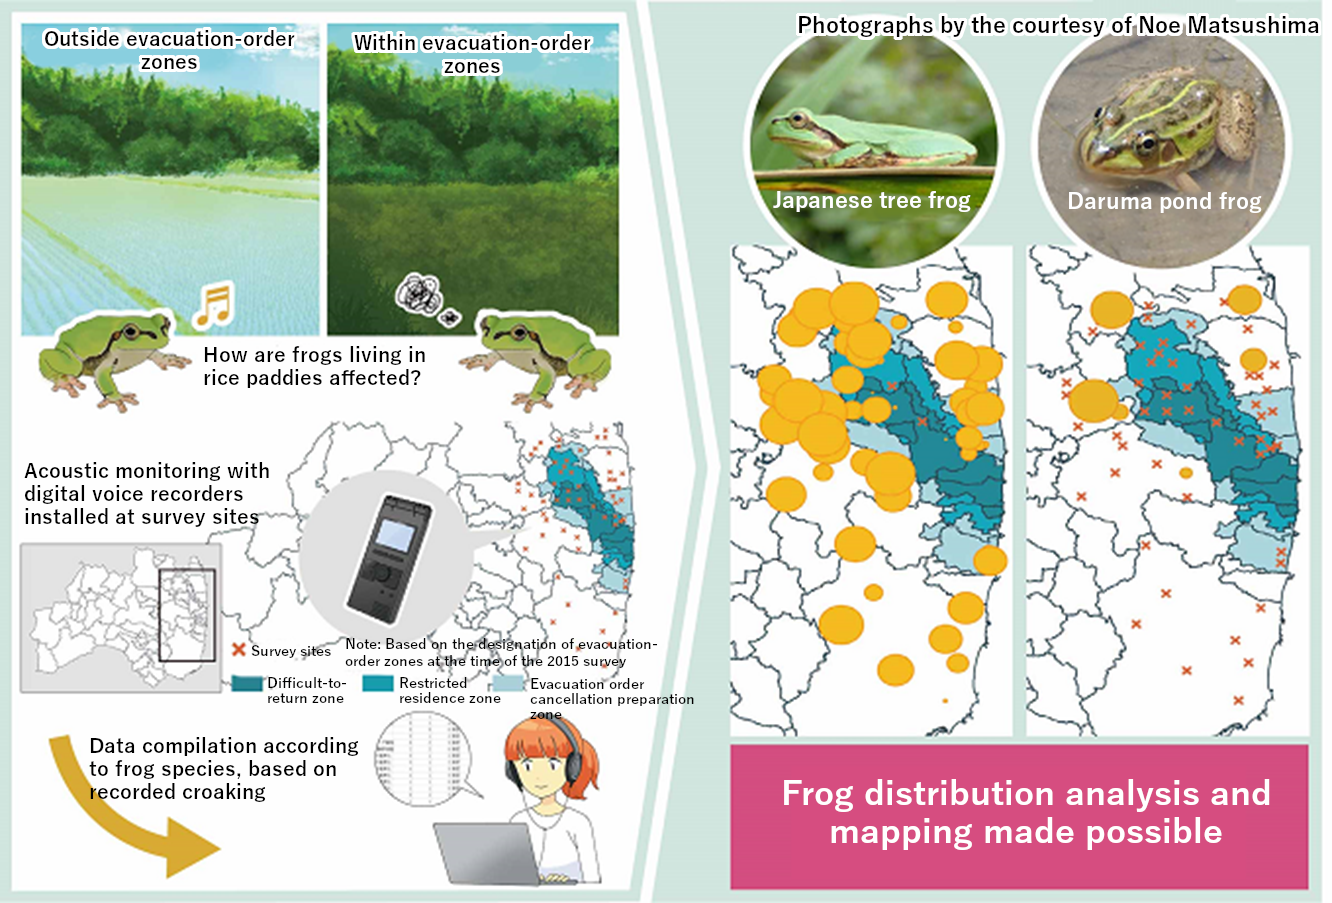
Fig. 3. Overview of the acoustic monitoring survey of frogs
The National Institute for Environmental Studies collected data on frogs by recording their croaking with recording devices (digital voice recorders) installed in and around evacuation-order zones.
It was the world’s first attempt to exhaustively and systematically compile and publish frog distribution information in and around evacuation-order zones designated after a nuclear power plant accident. The data is expected to help elucidate ecological changes in areas affected by such an accident due to the evacuation and return of residents.
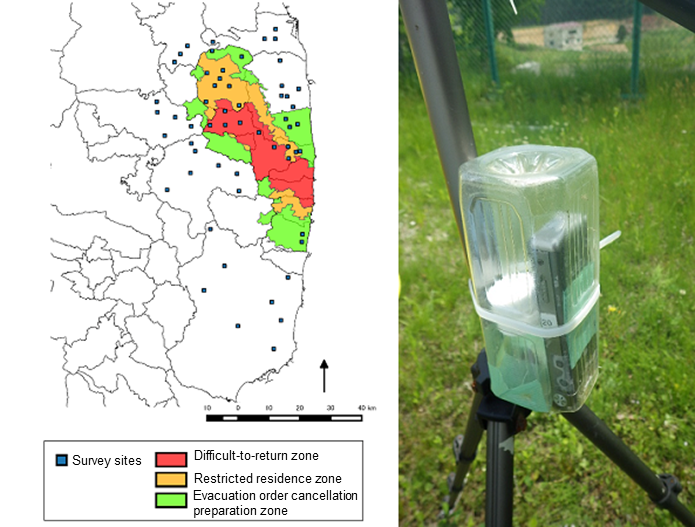
Fig. 4. Survey sites and recording device
The designation of evacuation-order zones is as of the time of the 2015 survey. Municipal boundaries are based on the Numerical National Land Information (administrative district data) provided by the Ministry of Land, Infrastructure, Transport and Tourism. (The same color-coding also applies to Figure 5.)
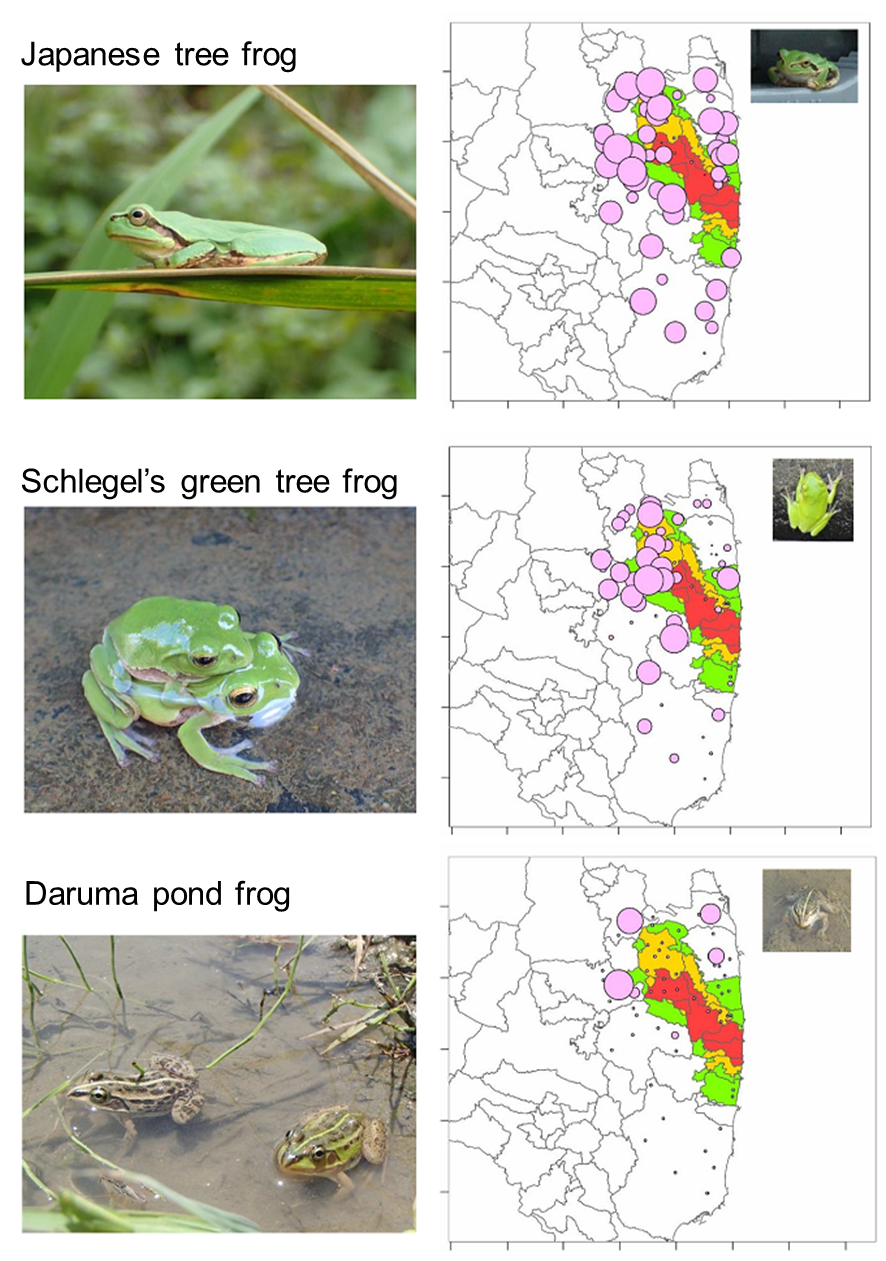
Fig. 5. Distribution bubble charts of three frog species based on acoustic data in 2014-2015
The size of the circle corresponds to the frequency of appearance of frogs. Municipal boundaries are based on the Numerical National Land Information (administrative district data) provided by the Ministry of Land, Infrastructure, Transport and Tourism.
(Frog photographs by the courtesy of Noe Matsushima, Senior Researcher Keita Fukasawa, and Senior Researcher Yoshioka)