Radioactivity and Air Dose Rate
(2020)
QHow are air dose rates expected to change over time, based on current knowledge? 【Example of analysis】
ASince the Fukushima accident, various institutions have surveyed the distribution of air dose rates using a wide range of measuring methods.
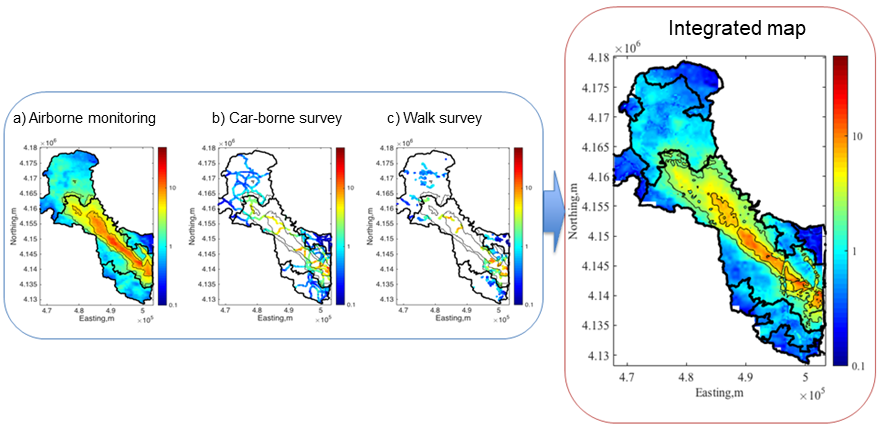
Air dose rate data with different characteristics have been obtained by these measuring methods. By integrating these data, we can create an air dose rate map with high accuracy and high spatial resolution across the target area.
For the creation, a hierarchical Bayesian statistical method may be used to perform computer-based estimations.
This statistical method helps to estimate uneven distribution of air dose rates with high resolution across the wide area affected by the accident.
By comparing the estimates with airborne monitoring results, we can generally correct some estimated values that are higher due to systemic reasons and reproduce a detailed distribution status.

Fig.1 Image of the integration of maps
Related articles
- How far does the radiation come from?(1)
- How far does the radiation come from?(2)
- Does the effect of air dose rate reduction vary between different decontamination methods? 【Example of analysis】
- How do air dose rates vary depending on radioactive cesium distribution in forests? 【Example of analysis】
References
- Wainwright, H. M., Seki, A., Chen, J. and Saito, K. (2017): A multiscale Bayesian data integration approach for mapping air dose rates around the Fukushima Daiichi Nuclear Power Plant, Journal of Environmental Radioactivity, vol. 167, 62-69. http://dx.doi.org/10.1016/j.jenvrad.2016.11.033
- Wainwright, H. M., Seki, A., Mikami, S. and Saito, K. (2018): Characterizing regional-scale temporal evolution of air dose rates after the Fukushima Daiichi Nuclear Power Plant accident, Journal of Environmental Radioactivity, vol. 189, 213-220. https://doi.org/10.1016/j.jenvrad.2018.04.006
