Information on treated water and decommissioning
(2021)
QIs it possible to visualize radiations? Also, is there a way to understand the situation of contamination inside the Fukushima Daiichi NPS buildings?
AThere are a lot of contaminated devices and rubble at the Fukushima Daiichi NPS, and the locations of contamination need to be three-dimensionally identified to gain an accurate understanding of contamination distribution. However, conventional methods using a survey meter or gamma camera*1 are more suited for spot locations and surfaces, and it is difficult to apply them for three-dimensional (3D) mapping of contamination distribution.
In response to such worksite demands, JAEA developed the integrated Radiation Imaging System (iRIS) for drawing 3D maps visualizing contaminated locations and air dose rates by combining a Compton camera*1 for visualizing radioactive materials, a survey meter, and a laser-based 3D spatial recognition device.
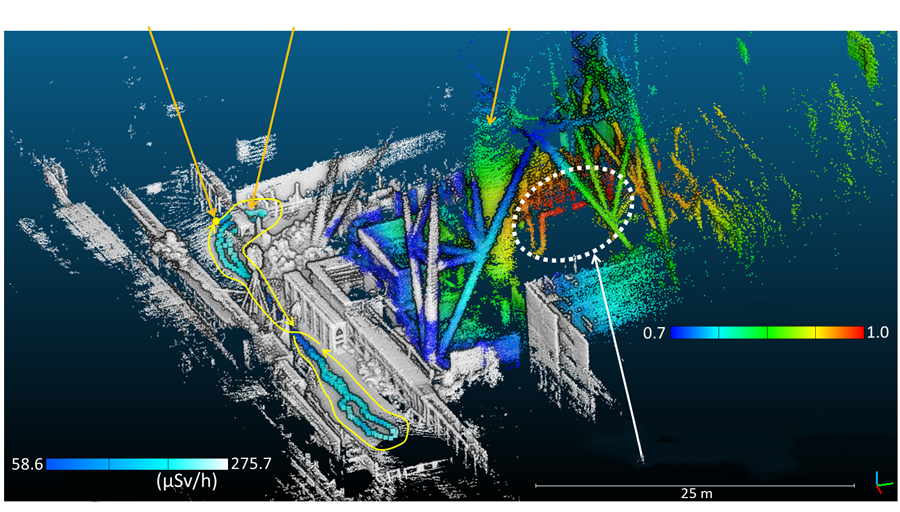
Fig. 1 3D map visualizing air dose rates and highly contaminated locations near the Unit 1/2 exhaust stack at Fukushima Daiichi NPS
Dose rates along the operator's walking route and highly contaminated locations visualized by the Compton camera are shown in color.
There are many devices, debris, buildings, and other items on the Fukushima Daiichi NPS site. Since they have radioactive materials attached to them, contamination is spreading three-dimensionally. In such a setup, radiation can come from any direction, and it has not been possible to understand the accurate distribution of contamination simply by measuring dose rates at a “spot” using conventional survey meter methods. In addition, spot measurement using a survey meter not only is time-consuming to perform 3D measurement for the entire work site but also causes unwanted exposure of workers to radiation.
In order to resolve these issues, JAEA has developed the integrated Radiation Imaging System (iRIS) that combines a Compton camera, which is a radioactive material visualization camera, a 3D scanner (hereinafter “3D-LiDAR”*2), and a survey meter for measuring dose rates.
Unlike the conventional usage of a Compton camera in which two-dimensional contamination distribution is obtained by stationary measurement, the iRIS enabled 3D mapping of contamination in a short period of time by survey operators walking around the survey target area without approaching highly contaminated areas. As a result of applying this method to the vicinity of the lower part of the Unit 1/2 exhaust stack on the Fukushima Daiichi NPS, 3D maps visualizing areas with high-level contamination were successfully drawn (Figs. 1 and 2). This map also shows air dose rates surveyed along the operator’s walking route. This 3D map can be observed from any point of view on a PC or tablet, and the Fukushima Daiichi NPS decommissioning site where hot spots exist can be overviewed from any direction. In addition, by using commercially available virtual reality (VR) goggles, it is possible to experience the decommissioning environment reproduced in a virtual space displayed together with the contamination distribution, which can be used for prior training of workers.
Further, by mounting this system on a robot, it will become possible to easily obtain a 3D contamination distribution map inside a high dose rate restricted access area such as a reactor building. Maps obtained by this method are expected to be highly useful for reducing the exposure dose of workers and for formulating practical decontamination plans.
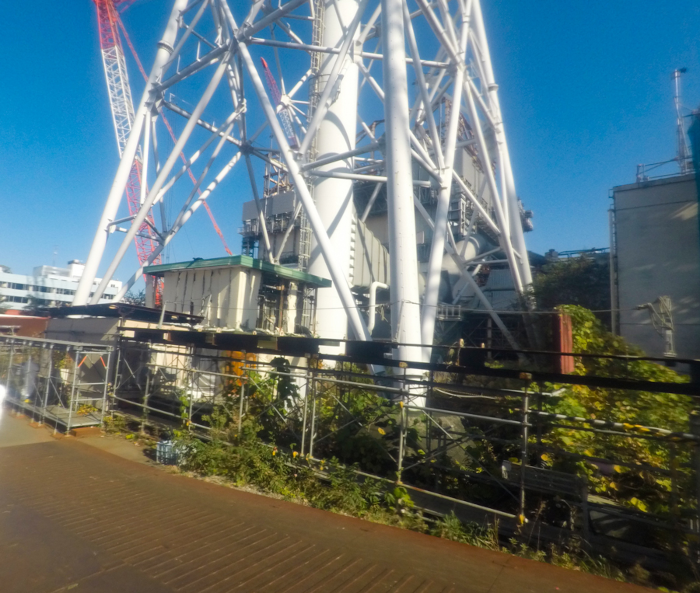
Fig. 2 The lower part of the Unit 1/2 exhaust stack
In the demonstration, a 3D map showing the contamination distribution was successfully drawn by an on-foot survey while pointing the device at the lower part of the exhaust stack without entering it, which is a high dose rate environment (see Fig. 1).
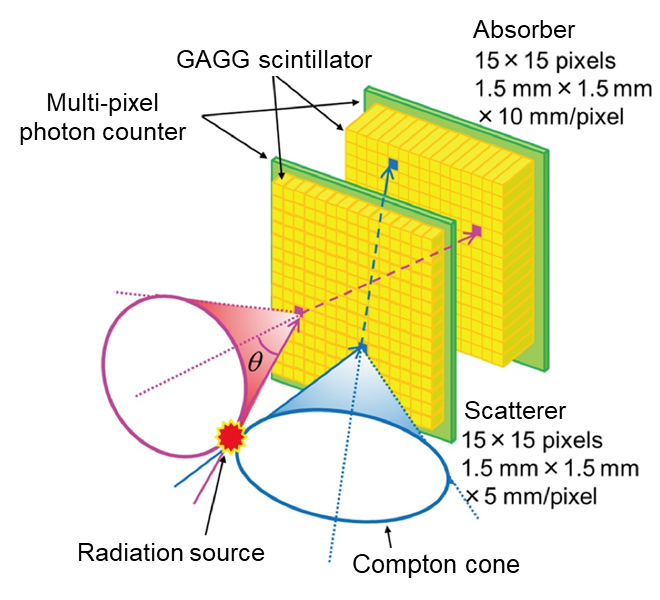
Fig. 3 Schematic illustration of a Compton camera
A virtual cone called a Compton cone is drawn in front of the camera to visualize a radioactive material at the intersection of the cones.
For the iRIS, we combined the three key devices shown in Fig. 4, namely, 3D-LiDAR, Compton camera and survey meter. The iRIS performs:
- simultaneous localization and mapping (SLAM)*6 using 3D-LiDAR to build a 3D model of the decommissioning site and frequent recording of the location and posture of the system while moving;
- synchronization of the SLAM information with the radiation travel direction information obtained at each location using the Compton camera;
→ It has become possible for the first time ever to three-dimensionally visualize contamination with data obtained while moving - frequent recording of dose rates along the walking route using the survey meter;
- drawing of a 3D contamination map using COMRIS, special software newly developed for the iRIS, which enables generating 3D maps from information obtained using multiple sensors like 1-3 above with some easy button operations.
By using this software, as shown in Fig. 1, it has become possible to display the dose rates and highly contaminated areas as a color contour map*7 in a virtual space on a PC.
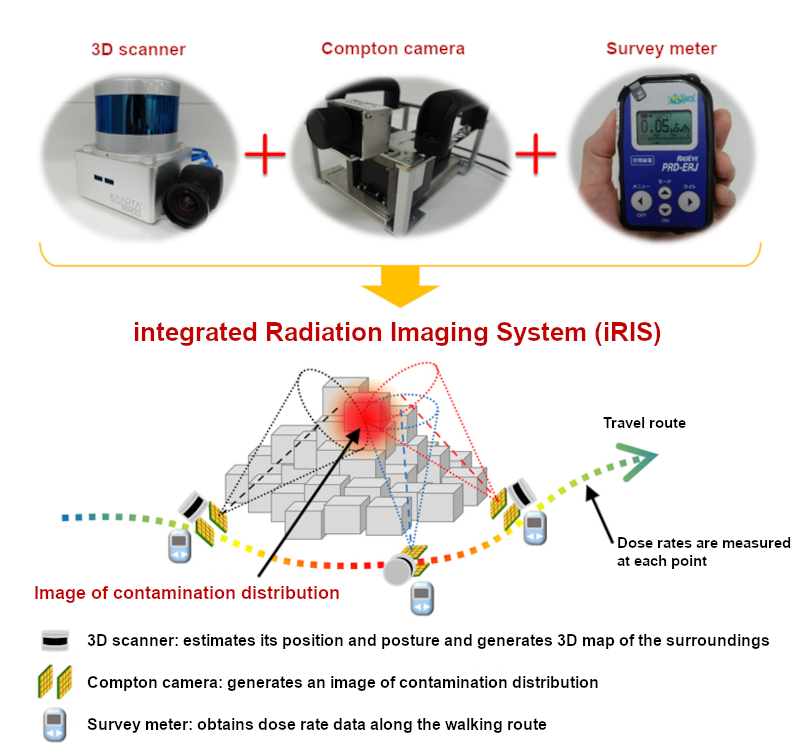
Fig. 4 The integrated Radiation Imaging System (iRIS) consisting of 3D-LiDAR (top-left), Compton camera (top-middle), and survey meter (top-right)
The contamination distribution imaged by the Compton camera and the dose rates measured by the survey meter along the travel route are projected on the 3D map of the work area acquired by the 3D scanner.
The demonstration was conducted in November 2020 with the cooperation of TEPCO near the Unit 1/2 exhaust stack on the Fukushima Daiichi NPS site. The lower part of the exhaust stack was high in dose rates, making it impossible for workers to stay for a long duration. In conventional fixed-point measurement using a Compton camera, the object needs to be measured from multiple points, necessitating repeated installation and moving of the Compton camera and measurement. However, a survey using this system was completed in less than five minutes by walking on a passageway with relatively low dose rates, staying away from the lower part of the exhaust stack. Based on the survey data, we successfully drew a 3D map visualizing locations with high-level contamination as shown in Fig. 1. Fig. 1 is a 3D contamination map drawn by projecting the distribution image of radioactive cesium, the main cause of contamination, in red on a 3D model around the exhaust stack. This is the first case of “visualization” of contamination at the Fukushima Daiichi NPS, achieved by continuous measurement while moving without getting close to any of highly contaminated areas.
In the future, we plan to proceed with the mapping of radiation distribution at much more inner sections of the Fukushima Daiichi NPS reactor building by mounting this system on a robot. By using this system, it becomes possible to collect data on contaminated spots and dose rates for a wide area in a short period of time, without stopping the robot on every measurement. In addition, by reproducing the Fukushima Daiichi NPS work site together with the contamination distribution in the virtual space, it may become possible to simulate in advance the effects of shield installation and decontamination on air dose rate reduction.
[Glossary]
*1 Gamma camera and Compton camera
Gamma cameras are roughly divided into pinhole cameras and Compton cameras shown below. Their features are described below.

Pinhole cameras are simple to use, but they tend to be large and heavy, making them unsuitable for measurement in narrow places. Compton cameras determine the travel direction of gamma-rays from the positions of interactions of the incident gamma-rays (a type of radiation) with each of the scatterer and absorber and the energy received. Since it employs a technique to analytically derive the radiation source, heavy shields are not required and the system can be downsized, though it is technically far advanced.
*2 3D-LiDAR
It stands for 3D Light Detection and Ranging, a sensor to measure the distance from an object by scanning the object with laser pulses and counting the time for reflected scattered light to return. In the demonstration, a 3D model of the work environment was acquired using this device.
*3 Scintillator
A fluorescent substance that emits light (scintillation light) when radiation hits it. It converts scintillation light into electrical signals and measures the number of incident radiations and energy.
*4 GAGG scintillator
One of scintillator crystals. GAGG stands for gadolinium-aluminum-gallium garnet. GAGG has a higher density than conventional scintillator crystals (NaI, CsI), so even a small crystal enables highly sensitive measurement of radiation. In addition, since it is not deliquescent and there is no need to worry about it deteriorating due to the moisture in the air, it can be used stably for a long period of time.
*5 Compton scattering and energy deposition at scatterer/absorber
Compton scattering is the process by which photons (gamma-rays) interact with electrons bound to atoms in a material and lose some of their energy. The lost energy is given to the electrons, and the energy is deposited by the electrons traveling in the scatterer or absorber.
*6 Simultaneous localization and mapping (SLAM)
A technology to simultaneously perform estimation of position and generation of a map of the surroundings. By using a camera or laser scanner, the system’s position and information on the surrounding environment such as obstacles can be recognized at the same time. This technology is also applied to the automatic driving technology for cleaning robots and automobiles.
*7 Contour map
A map in which data points of the same value are connected by a line (isoline). A map that has isolines at certain intervals is called an isoline map, which allows intuitive understanding of attributes and distribution in the map. To make the isoline map easier to see, the areas between isolines are sometimes colored using gradually changing colors (color contour map).