Information Disclosure
(2020)
QIs it possible to make community-based radiation maps?
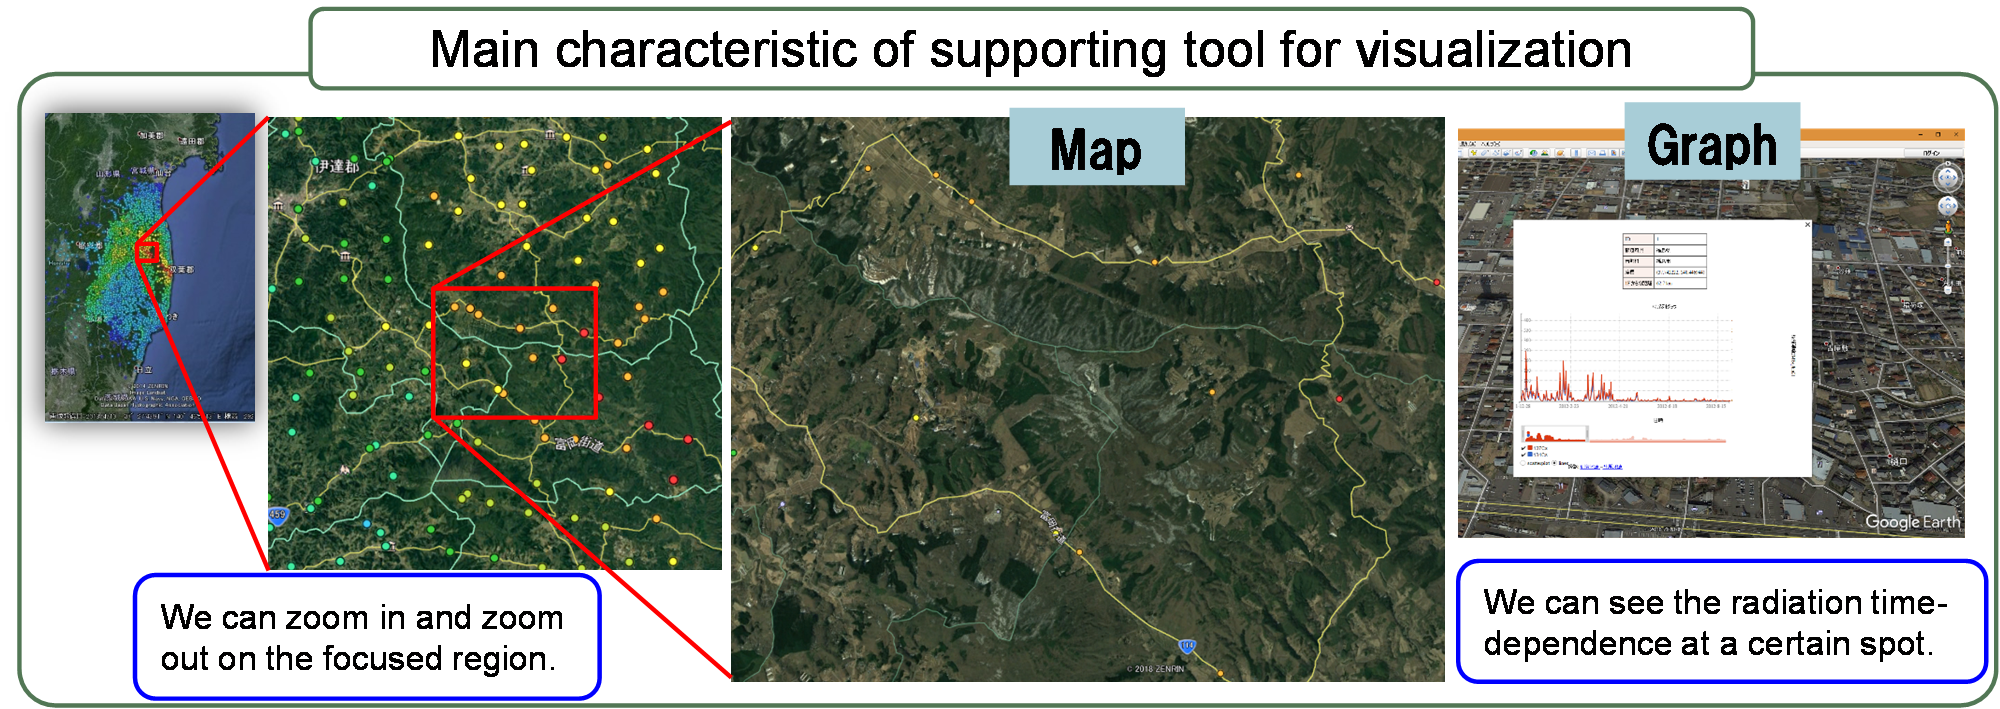
AIn the website on “Database for Radioactive Substance Monitoring Data”, JAEA provides supporting tools for data visualization by users, such as creating a detailed radiation map and making a graph for plotting time-dependence of radiation.
- Among the environmental monitoring results released on the website, about 60 kinds of data such as those of air dose rates and car-borne survey can be visualized.
- Community-based maps and graphs can be created by combining with free software such as Google Earth.